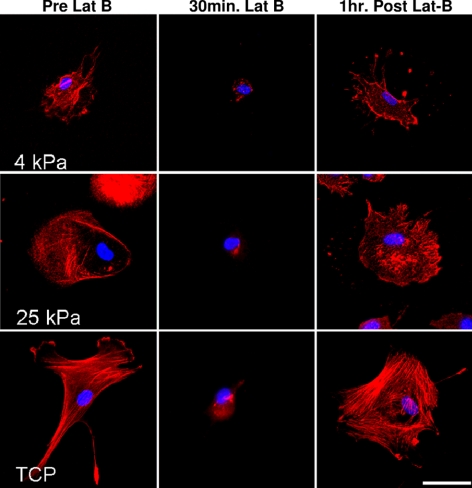
Figure 4.
Representative images demonstrate the effect of substratum compliance and Lat-B treatment on HTM cell area. HTM cells on 4 kPa substrates were much smaller than cells on TCP both before and after Lat-B treatment. Note the dense packing of actin fibers 1 hour after Lat-B removal on TCP surfaces. This was consistent with an earlier report of abnormal fiber patterns at 90 minutes after Lat-B removal.3 Scale bar, 50 μm.

