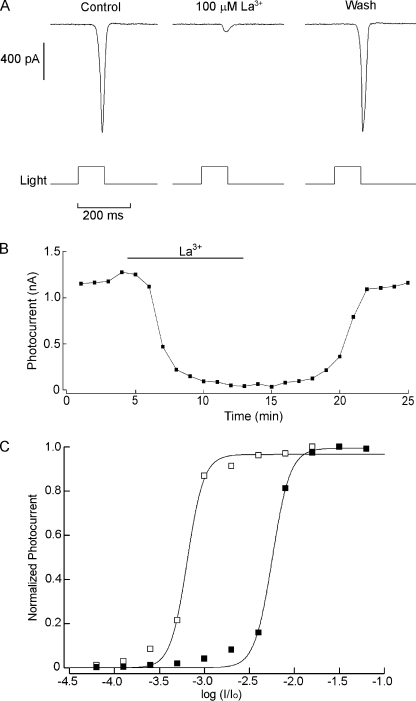
Figure 6.
Blockade of the photocurrent by lanthanum. (A) Joseph cell stimulated every minute with light flashes of constant intensity (4.9 × 10¹² photons × s−1cm−2). The panel shows photocurrent traces in control conditions at the peak of the inhibition during bath superfusion with 100 µM and after washing the blocker. (B) The photocurrent amplitude is plotted as a function of time to illustrate the time course of the blockage. (C) Normalized intensity–response curve determined in control conditions and in the presence of 100 µM La3+. Stimulating light was raised at 0.3 log increments. Lanthanum caused a substantial right shift of the curve by approximately one log unit.

