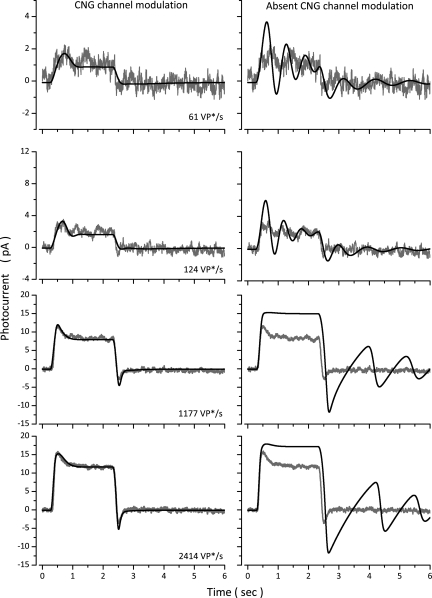
Figure 11.
The physiological role of Ca-dependent CNG channel modulation in step photocurrents. Experimental photocurrents were measured in a dark-adapted bass single cone in response to steps of 61, 124, 1,177, and 2,414 VP*. The panels on the left illustrate experimental (gray traces, noisy) and simulated (black traces, noiseless) photocurrents computed with the normal complete model (Table 4, Cone 1). The panels on the right reproduce the same experimental data (gray traces, noisy), now superimposed by simulated photocurrents (black, noiseless traces) computed with a model in which CNG channel modulation is omitted.

