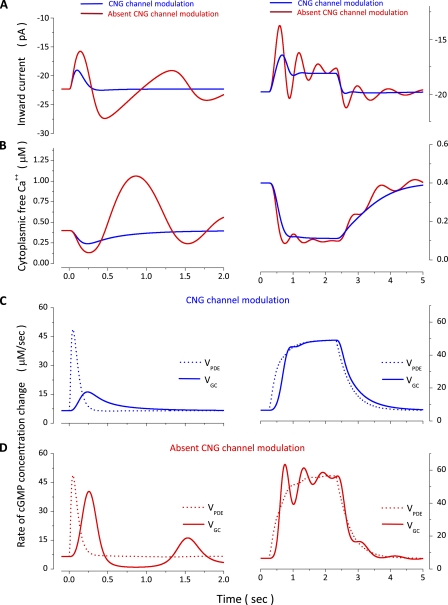
Figure 12.
Simulated dynamics of several molecular events underlying flash and step photoresponses in bass single cones. Left panels show various biochemical and biophysical events elicited by a 10-msec flash of 167 VP* intensity (Table 3, Cone 1). Right panels show the same events elicited by a 2-s step of 124 VP*/s in a different cone (Table 4, Cone 1). (A and B) The inward outer segment membrane current and the cytoplasmic free Ca2+ concentration. Superimposed in each panel are the results of simulations with the complete model (blue traces) and one in which CNG channel modulation is omitted (red traces). (C) Enzymatic activity of PDE (dashed line) and GC (solid line) and their change with light computed with the complete model. (D) Enzymatic activity of PDE (dashed line) and GC (solid line) computed with the model that omits CNG channel modulations.

