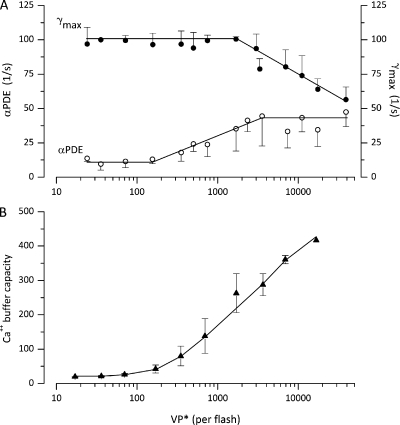
Figure 4.
Light dependence of the values of adjustable parameters inferred from successful simulations of flash photocurrents. Data points are the mean ± SD of values computed in 18 single cones. The light intensity shown on the graph is the mean of intensities binned within about plus or minus 10% of the mean. (A) PDE* inactivation rate () and VP* phosphorylation rate (). (B) Ca2+-buffering capacity ( Eq. 2.11). Continuous lines are drawn by eye to join the data points.

