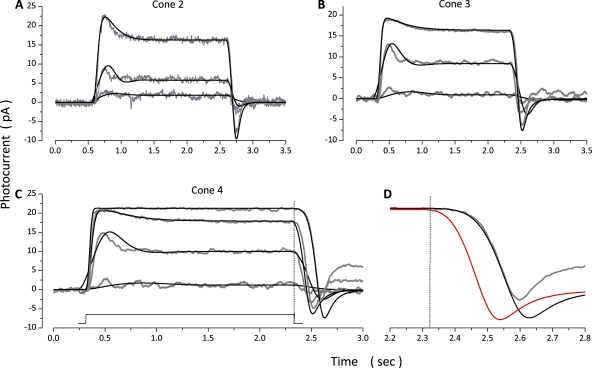
Figure 6.
Experimental (gray traces, noisy) and simulated (black traces, noiseless) step photocurrents measured at −40 mV in three different dark-adapted bass single cones. (A) Intensities tested were 171, 773, and 8,770 VP*/s. (B) Intensities tested were 50, 963, and 10,320 VP*/s. (C) Intensities tested were 50, 963, 10,320, and 41,466 VP*/s. The values of the parameters used in the simulations shown are listed in Table 4. (D) A time-expanded view of the end of the response to 41,466 VP*/s shown in C. At this intensity, photocurrent amplitude was saturated. The unsuccessful simulations illustrated in red were computed when was kept at the same value used to fit the responses to dim stimuli.

