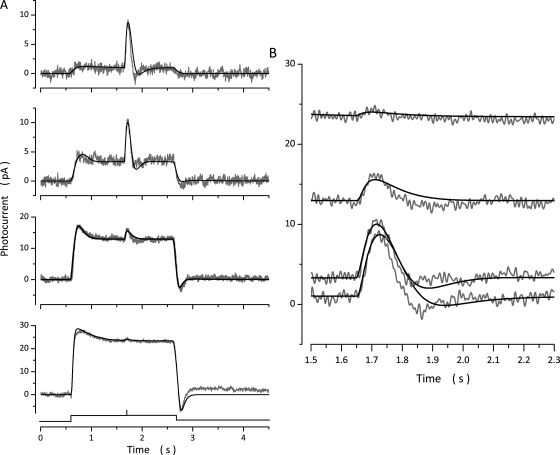
Figure 8.
Experimental (gray traces, noisy) and simulated (black traces, noiseless) photocurrents elicited by the same intensity flash superimposed on light steps of varying intensity. (A) Photocurrents generated by a 150-VP* flash delivered 1 s after the onset of light steps of intensities: 171, 773, 8,770, and 35,236 VP*/s. (B) Time-expanded view of the response to the constant intensity flash. Flash photocurrent on 171 VP*/s background was 7.3 pA in peak amplitude, 80 msec time to peak. On 773 VP*/s background it was 6.5 pA in peak amplitude, 77 msec time to peak. On 8,770 VP*/s background it was 2.9 pA in peak amplitude, 73 msec time to peak. On 35,236 VP*/s background it was 0.9 pA in peak amplitude, 63 msec time to peak.

