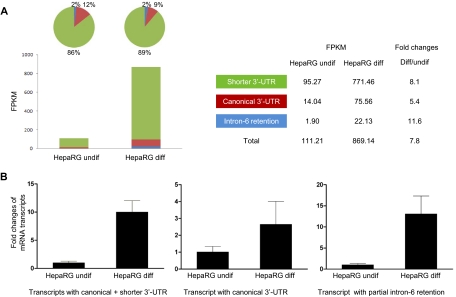
Fig. 3.
Expression of the CYP3A4 mRNA transcripts determined by RNA-Seq (A) (n = 1) and RT-qPCR (B) (n = 3) in HepaRG cells before and after differentiation. FPKM is used to present expression levels of each CYP3A4 mRNA transcript in RNA-Seq experiments. In RT-qPCR experiments, the average expression level in undifferentiated HepaRG cells is set as 1. Fold changes of expression levels of each transcript in differentiated HepaRG cells are compared with the values in undifferentiated HepaRG cells. Black column, mean; bar, S.D. of biological triplicate samples.

