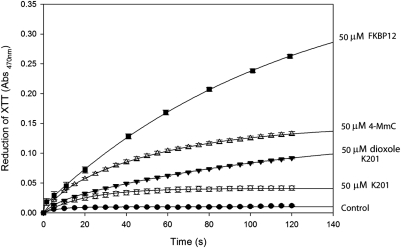
Fig. 2.
Comparison of electron donor properties of control (no addition; ●), 50 μM K201 (○), 50 μM dioxole derivative of K201 (▾), 50 μM 4-MmC (▵), and 50 μM FKBP12 (■). All time-dependent scans were repeated at least three times under continuous illumination. Values shown are means ± S.E (n = 3). Curves shown are best fits to an exponential rise to maximum.

