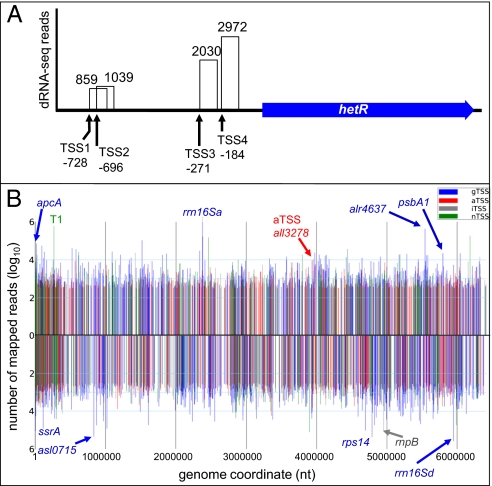
Fig. 1.
Genome-wide identification of TSS in Anabaena 7120. (A) Differential RNA-seq identifies single TSS in complex promoter regions as exemplified by the hetR gene. The total number of reads mapped to each 5′ end is indicated for each of the four previously described TSS. (B) Distribution of 3401 TSS with ≥300 reads each along a linear plot of the Anabaena 7120 chromosome. TSS mapped for the forward strand are plotted above the x axis, and for the reverse strand below. The number of sequence reads is given on the y axis. The location of each TSS according to SI Appendix, Fig. S1A served for classification as gTSS (blue), nTSS (green), aTSS (red), or iTSS (gray). Selected TSS for each of the four classes are annotated.

