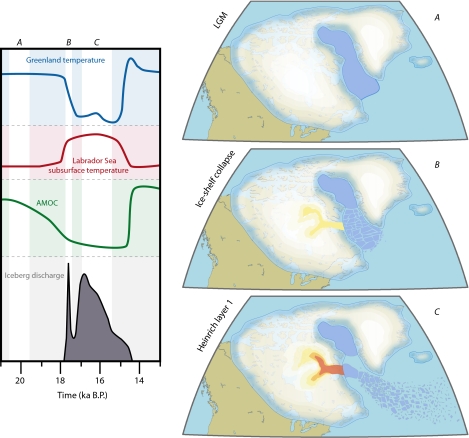
Fig. 1.
Schematics of the Heinrich event 1. Left: Time series illustrate the evolution of the main variables involved with the triggering mechanism. A, B, and C indicate critical steps in the Laurentide ice sheet around Heinrich event 1. Right: Warm colors in B and C represent acceleration and thinning in ice streams of the Hudson Bay and Hudson Strait area.

