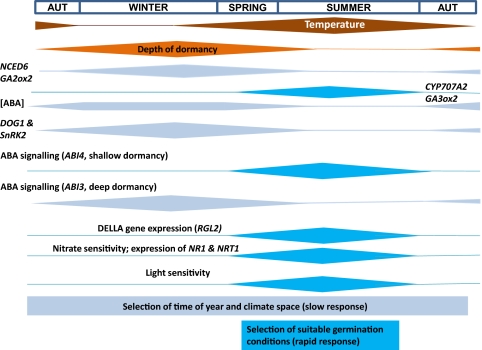
Fig. 6.
Seasonal timing of molecular physiological events during dormancy cycling in the field. The height of each bar indicates the amplitude of the response measured across four seasons. Temperature represents the annual fluctuation in soil temperature at seed depth. Depth of dormancy is related to the AR50 of Cvi seeds in the field. Other bars represent seasonal changes in [ABA], gene expression and environmental responses. Temporal sensing represents the slow seasonal change in dormancy for the selection of time of year and climate space (light blue bars). Spatial sensing represents the period of potential rapid change during shallow dormancy if suitable germination conditions are detected (dark blue bars).

