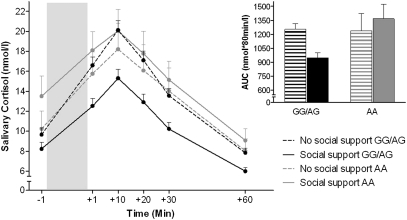
Fig. 1.
Mean salivary cortisol levels before, during (shaded area), and after acute social stress in individuals receiving social support or no social support. Error bars represent SEM. Inset: Bar graph of area under the response curves (AUC), representing aggregated hormone levels through the six measurement points.

