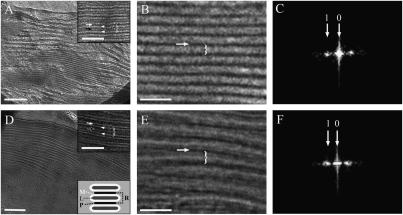
Fig. 1.
Ultrastructural analysis of thylakoid membranes in Arabidopsis chloroplasts. (A, B, D, and E) Low- (A and D) and high- (B and E) magnification cryo-TEM images of vitrified dark- (A and B) and light- (D and E) adapted leaf samples. The stacking repeat unit, which includes the thylakoid lumen, the two encasing membrane bilayers, and the width of one partition gap (white arrow), is marked by a brace. (A, Inset and D, Upper Inset). Defocus images of the grana in which the membrane bilayers (white arrowheads) are clearly discerned. The luminal space is marked by a black arrow. (D, Lower Inset). Scheme depicting the relation between the stacking repeat distance (R), membrane bilayers (M), lumen width (L), and partition gap (P); R = 0.5P + M + L + M + 0.5P. (C and F) Power spectra of grana from dark- (C) and light- (F) adapted leaves. [Scale bars, 200 nm (A and D); 50 nm (B and E, and Insets).]

