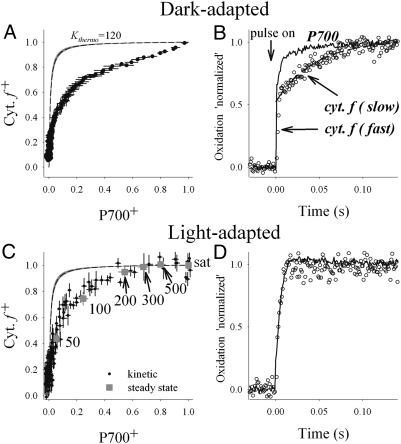
Fig. 4.
Redox kinetics and equilibration between cytochrome f and P700 measured in dark-adapted (A and B) and light-adapted (C and D) leaves. (A) Equilibration plot of cytochrome f and P700 in dark-adapted leaves, generated from relaxation kinetic measurements following a 100-ms light pulse. The dashed line shows the theoretical equilibration curve (Kthermo), calculated using +352 and +472 mV for the redox midpoint potentials of cytochrome f and P700, respectively. The gray delineation of the line represents the range of values reported in the literature for the potentials (22). Error bars represent SE (n = 8). (B) Oxidation kinetics of cytochrome f and P700 induced by a saturating light pulse in dark-adapted leaves. The oxidation kinetics of P700 is monophasic, whereas that of cytochrome f is biphasic, exhibiting clearly distinguished slow and fast components. (C) Equilibration plot of cytochrome f and P700 in light-adapted leaves (black circles). Gray squares show the steady state oxidation levels in leaves exposed to different light intensities, in the absence of methylviologen. Sat, saturated light intensity. (D) Oxidation kinetics of cytochrome f and P700 in light-adapted leaves. Note that the slow cytochrome f component seen in dark-adapted leaves is no longer apparent. The absolute (nonnormalized) cytochrome f amplitudes are virtually identical for light- and dark-adapted samples.

