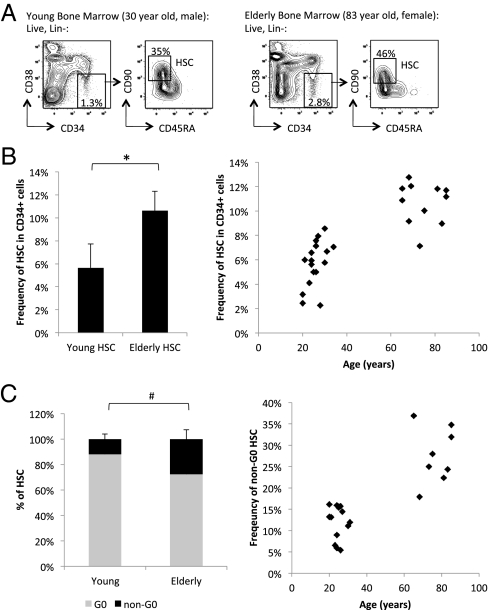
Fig 1.
Increased frequency of HSC in normal elderly bone marrow compared to young. (A) Gating strategy and flow cytometric profile of HSC (Lin−, CD34+, CD38−, CD90+, CD45RA−) in representative hematopoietically normal young (Left) and elderly (Right) bone marrow samples. The left panels for each sample are gated on lineage negative (Lin−) live cells, and the right panels are gated on Lin−CD34+CD38− live cells. (B) Summary of HSC as frequency of total Lin−CD34+ population from multiple young (n = 13) and elderly (n = 11) bone marrow samples. *P < 10−7. (C) Summary of quiescent G0 (Hoechst 33342low, Pyronin Ylow, correlating with 2N DNA and low levels of RNA) and non-G0 (Pyronin Yhigh, correlating with 2N to 4N DNA and higher levels of RNA) HSC frequency out of total HSC from multiple young (n = 13) and elderly (n = 8). # P < 0.013. Error bars represent standard deviation.

