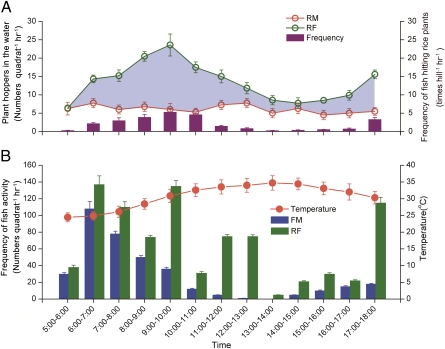
Fig. 3.
Fish activity and rice planthopper removal in experiment 1. (A) Frequency at which fish hit rice plants (bars, hits per hill per hour) and total numbers of rice planthoppers (lines, numbers per quadrat) collected from the quadrats B and D (Fig. S5). Shading between the lines indicates the numbers of planthoppers falling into the water, presumably because of fish activity. (B) Frequency of fish (bars) occurring in quadrats A and C (SI Text, section S2, and Fig. S5) in rice–fish coculture (RF) and fish monoculture (FM), and air temperature (line) in experiment 1. Error bars are SE.

