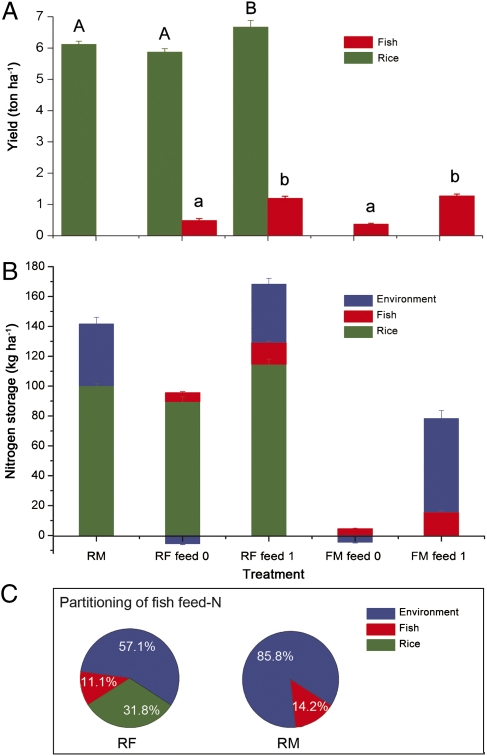
Fig. 6.
(A–C) Yield of rice and fish (A), N balance (B), and the fate of N input (C) in experiment 2. Bars in B show balance of N input and output in RM, RF without fish feed (RF feed 0), RF with fish feed (RF feed 1), FM without feed (FM feed 0), and FM with feed application (FM feed 1). A negative value for N in the environment means that some fraction of N in rice or fish was from the environment, and a positive value for N in the environment means that some portion of the input N was not used by rice and fish but remained in the field. Pie charts in C show partitioning of N derived from fish feed in harvested rice, harvested fish, and the environment in RF and FM (e.g., 11.1% and 14.2% of the N supplied by fish feed was estimated to be contained in fish in RF and FM, respectively). The calculations for the balance of N output and input within each system (RM, RF, or FM) are described in SI Text, section S5. The calculations used to determine the fate of N are described in SI Text, section S6. In A, means for rice yield with the same uppercase letter or means for fish yield with the same lowercase letter are not significantly different (P > 0.05). RM, rice monoculture; RF, rice–fish coculture; FM, fish monoculture. Error bars are SE.

