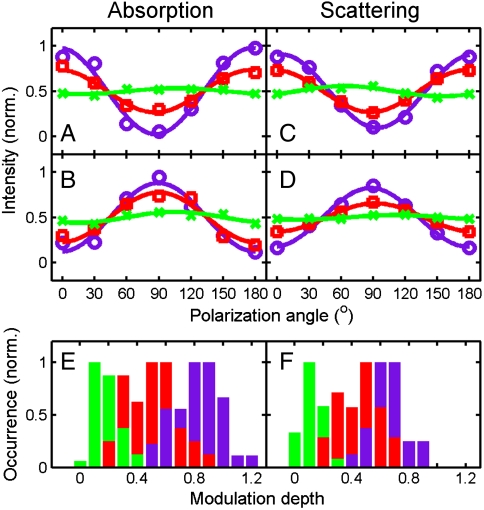
Fig. 3.
Polarization of NP ring SPs for absorption and scattering intensities along an NP ring. (A and B) Polarization dependence of the photothermal intensity of the local ring segments marked by the yellow and cyan rectangles in Fig. 1A, respectively. Purple, red, and green symbols represent excitation wavelengths of 785, 675, and 514 nm. The lines are fits and yield modulation depths of M785 = 0.93 and 0.76; M675 = 0.47 and 0.55; M514 = 0.06 and 0.12. (C and D) Polarization dependence of the corresponding scattering intensity for the same local ring segments. Purple, red, and green symbols represent the spectral windows of 800 ± 20, 700 ± 20, and 550 ± 20 nm. The lines are fits and yield modulation depths of M800 = 0.82 and 0.65; M700 = 0.47 and 0.31; M550 = 0.11 and 0.05. (E and F) Histograms of the modulation depth obtained from the photothermal and scattering polarization traces, respectively. For this analysis, the ring was divided into 40 and 24 segments for the photothermal and scattering measurements, respectively. Note that the colors of the bars correspond to those of the polarization traces.

