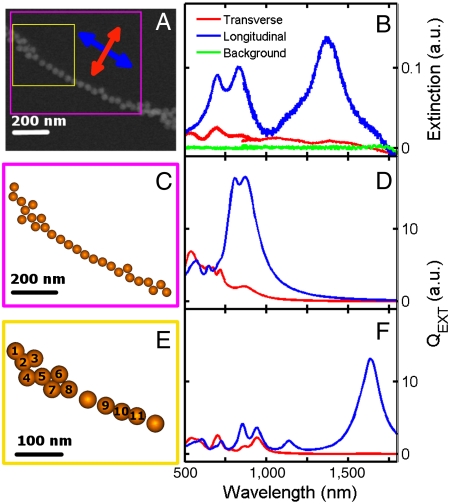
Fig. 4.
Experimental and simulated extinction spectra for a segment of an NP ring. (A) SEM image of a ring segment composed of 40-nm gold NPs. (B) Extinction spectra of the ring segment in A recorded with excitation polarization parallel (blue) and perpendicular (red) to the 1D NP alignment direction. (C and D) GMT calculations for the ring segment marked by the magenta square in A. The modeled NP arrangement in C was taken from the SEM image keeping the minimum surface-to-surface separation between neighboring NPs greater than 1 nm. (E and F) FEM calculations for the ring segment marked by the yellow square in A. For the FEM calculations, the NPs labeled 1–8 and 9–11 were allowed to touch and hence coupled conductively.

