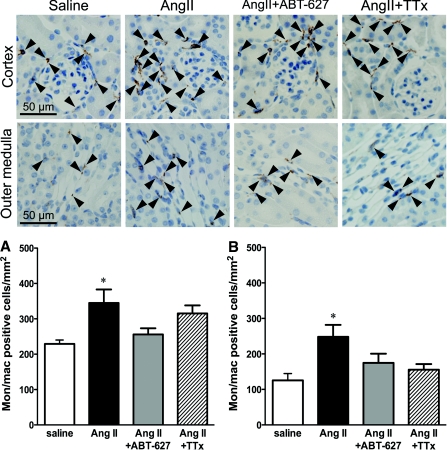
Figure 3.
Representative histologic images of monocyte and macrophage staining in the renal cortex and outer medulla for saline-, AngII-, AngII+ABT-627-, and AngII+TTx-treated mice. Magnification, ×40. (A) Quantification of monocyte/macrophage (mon/mac)-positive cells in the renal cortex. (B) Quantification of monocyte/macrophage (mon/mac)-positive cells in the renal outer medulla. For all groups, monocytes and macrophages were primarily localized in proximity to glomeruli in the renal cortex and vascular structures (i.e., vasa recta) in the outer medulla. Data are means ± SEM. *P < 0.05 versus saline (n = 8 to 10).

