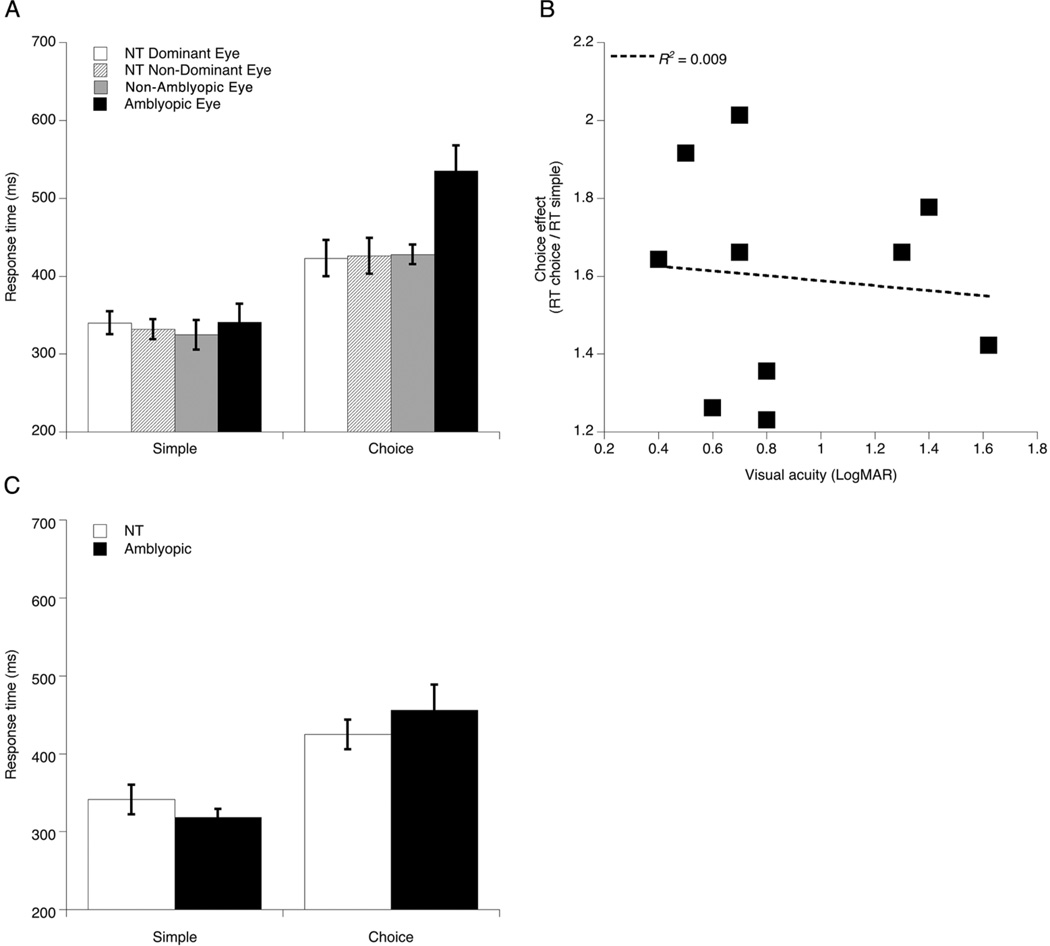
Figure 4.
(A) Results from the simple and choice response tasks in the visual modality: mean response times for Neurotypical (NT) and Amblyopic participants, by eye. Error bars indicate standard errors of the mean. (B) Choice effect for Amblyopic participants (RT choice / RT simple) versus LogMAR visual acuity of the amblyopic eye. Dashed line represents best fitting linear regression. (C) Results from the simple and choice response tasks in the auditory modality: mean response times for each task, for Neurotypical (NT) and Amblyopic participants. Error bars indicate standard errors of the mean.

