Figure 7.
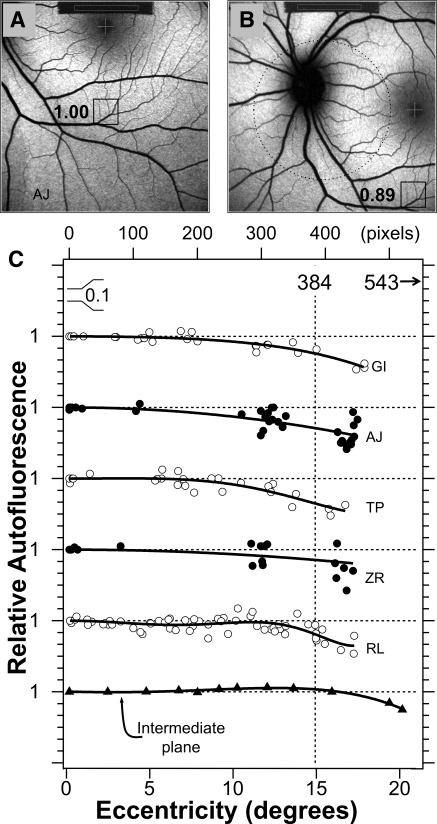
Testing the uniformity of qAF images. Images for an inferior (A) and nasal (B) fixation. The boxed areas correspond with the same fundus areas (100 × 100 pixels) located at a fixed horizontal and vertical offset from the center of the fovea. The numbers are the ratios of the mean GL in that area to the mean GL in the same area when it is located in the center of the field. Such comparison was repeated 15 to 30 times for different fundus sites and fixation positions. Dotted circle: a 20°-diameter area centered in the field. (C) Relative AF for five subjects as a function of eccentricity. The bottom profile was measured in the intermediate plane of the HRA2 by placing a uniformly fluorescent material in that plane. Profiles were displaced for clarity; each horizontal dashed line corresponds to a ratio of 1 for the profile below it (0.1/division). Vertical dashed line: the eccentricity of 768/2 = 384 pixels (15°) and the corners of the image have an eccentricity of 543 pixels (23°). The smooth lines are sixth-degree polynomials that were fitted through the data (even terms only, offset = 1). The mean relative AFs (±SD) at 10° and 15° eccentricity were 0.95 ± 0.03 and 0.84 ± 0.05, respectively.

