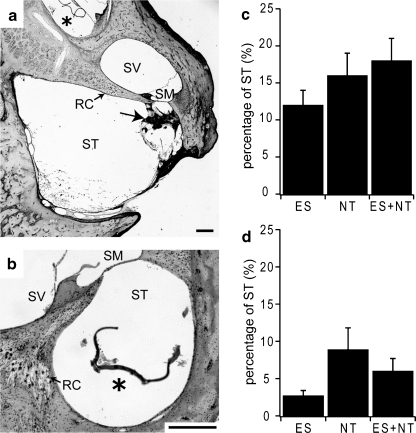
Fig. 9.
Example images of cochlear sections at location ii (a) and location iv (b) illustrates the extent of tissue response associated with cochlear implantation (see inset in Fig. 1b). New bone growth (a, arrow) in the lower basal turn and a capsule (*) in the middle turn (a) and upper basal turn (b) are evident. There was minimal tissue response to the presence of the capsules. Scale bar 200 μm, Average (± SEM) tissue response (c) and new bone growth (d) as a percentage of the scala tympani area. There was no statistical difference between the treatment conditions. ES = electrical stimulation; NT = neurotrophins; RC = Rosenthal’s canal; SM = scala media; SV = scala vestibuli; ST = scala tympani. * - significant difference

