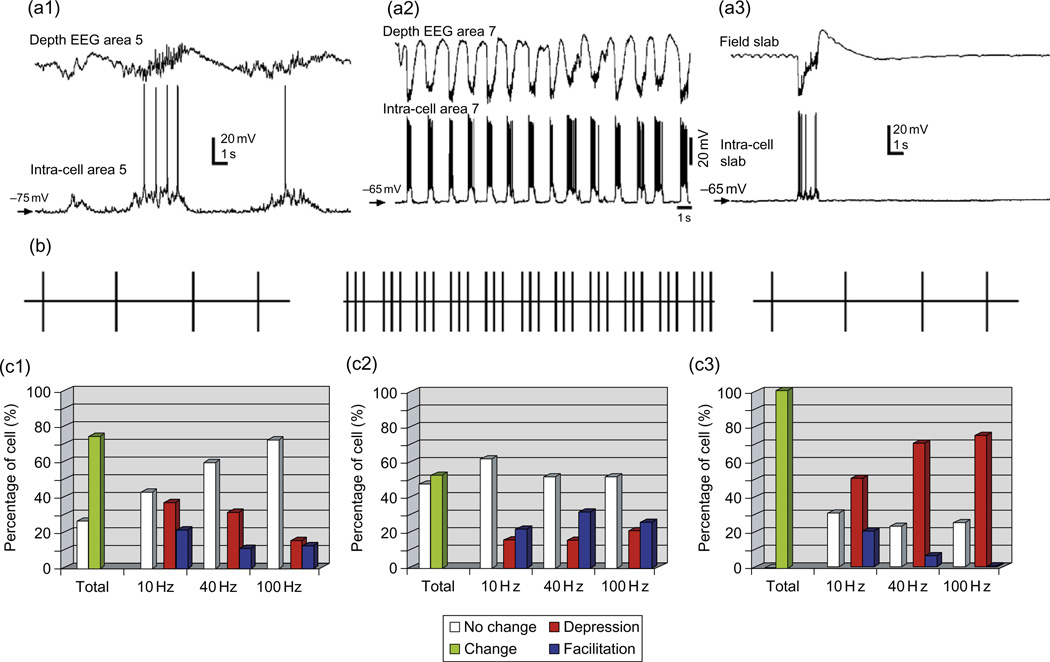
Fig. 4.
Mid-term plasticity in cortical network with different levels of activity. (a) Examples of field potential (upper trace) and intracellular (lower trace) recordings from area five to seven cortical neurons during barbiturate anesthesia (a1), ketamine–xylazine anesthesia (a2) and neocortical slab of cat anesthetized with ketamine–xylazine (a3). (b) Experimental protocol in which single stimuli were applied every two seconds to collect control values of responses, single stimuli were followed by 10, 40, or 100 Hz pulse-trains. During extinction, single stimuli were applied every 2 s as in control. (c) Histograms showing the percentage of cells that displayed no change (white) or a change of the response (green) for at least one of the tested frequencies, and for each frequency the percentage of cells that displayed no change (white), a decrease (red), or an increase (blue) of the response. Experimental conditions in (c1–c3) are the same as in (a1–a3). (Modified from Crochet et al., 2006).

