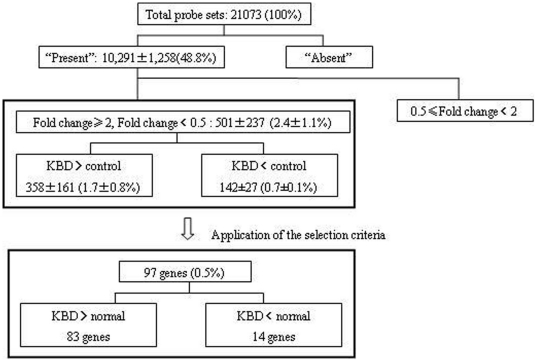
Figure 1. Flow chart for the identification of the differentially expressed genes in PBMCs of KBD patients and healthy controls.
The terms “present” and “absent” represent the expression levels of the transcripts described in the Materials and Methods section. Values are the mean±SD number and percentage of transcripts. See Materials and Methods for details of the selection criteria.

