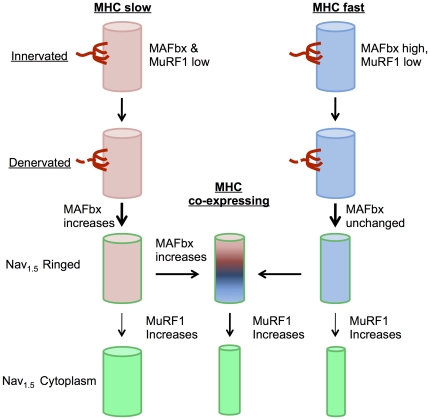
Figure 8. Schematic representation of atrophy in MHC slow versus MHC fast myofibers following denervation in aging muscle.
Thickness of arrow indicates relative proportion of fibers taking a given path. Briefly, upon denervation, MHC slow fibers exhibit increased MAFbx expression, followed by the majority of denervated fibers beginning to co-express MHC fast, coincident with initiation of atrophy. Upon denervation of MHC fast fibers, MAFbx is unchanged but atrophy is already seen, followed by a majority of denervated fibers beginning to co-express MHC slow. MuRF1 increases with prolonged duration of denervation in all MHC categories and is associated with further atrophy in MHC fast and MHC co-expressing myofibers.

