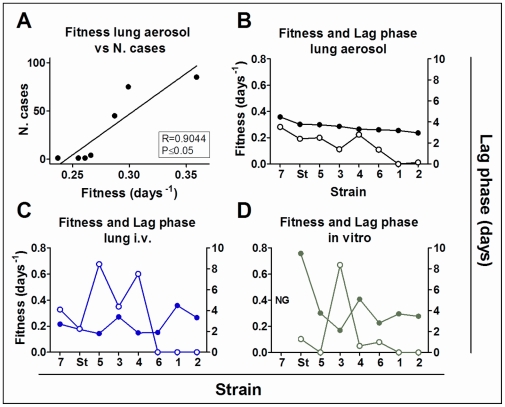
Figure 5. Fitness and Lag phase results.
Comparison of fitness values from the different experiments with respect to the number of clinical cases detected (A) and the evaluated lag phase(B–D). A: correlation between fitness values from lung aerosol infections and the number of clinical cases reported, which resulted significant; B–D: fitness (left axes, filled circles) and lag phase (right axes, unfilled circles) of each experiment with respect to the different strains in the lung after aerosol infection (B), lung after IV infection (C) and in vitro assay (D).

