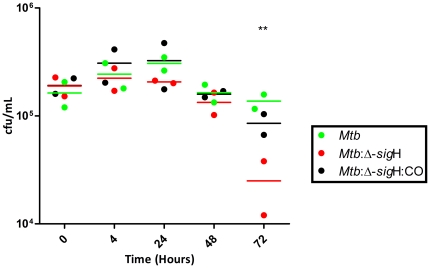
Figure 1. Comparison of infection of Rh-BMDM with Mtb, Mtb:Δ-sigH and Mtb:Δ-sigH:CO.
Growth progression of the infection by Mtb, the Mtb:Δ-sigH mutant and the mutant-complemented strain in Rh-BMDMs over the course of time measured by CFU analysis. The figure shows the arithmetic means ± standard deviations for two biological replicate experiments, with each replicate data comprising of a summarized value from different relevant dilutions and multiple platings.

