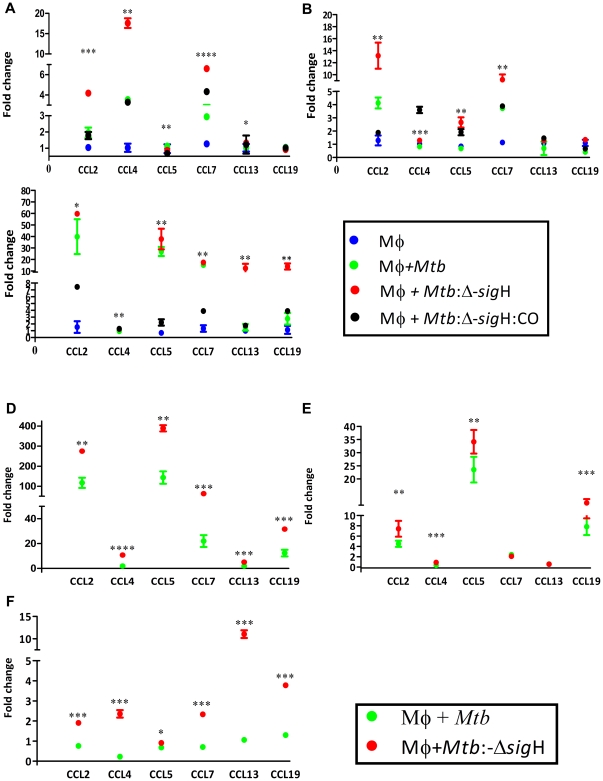
Figure 2. Comparison of chemokine-expression in Rh-BMDM infected with Mtb or Mtb: Δ-sigH at the RNA level.
Expression values are shown for DNA microarray experiments at 0 (A), 4 (B) and 24 (C) hrs. Results for uninfected cells are represented by blue circles, while those for Mtb, the mutant and the complemented strain are represented by green, red and black circles, respectively. Values represent responses that were statistically different from the Rh-BMDM (Mφ) responses (p<0.05). Results are representative of two independent experiments. *, p<0.05; **, p<0.01, ***, p<0.001 and ****, p<0.0001. Expression values are also shown for RT-PCR experiments at 0 (D), 4 (E) and 24 (F) hrs. Results for Mtb are represented by green open boxes while those for the mutant are represented by red boxes. RT-PCR arrays specific for the chemokines pathway were used to confirm microarray results. GAPDH was used as the invariant housekeeping control for normalization. The figure shows the arithmetic means ± standard deviations for two biological replicates. *, p<0.05; **, p<0.01, ***, p<0.001 and ****, p<0.0001.

