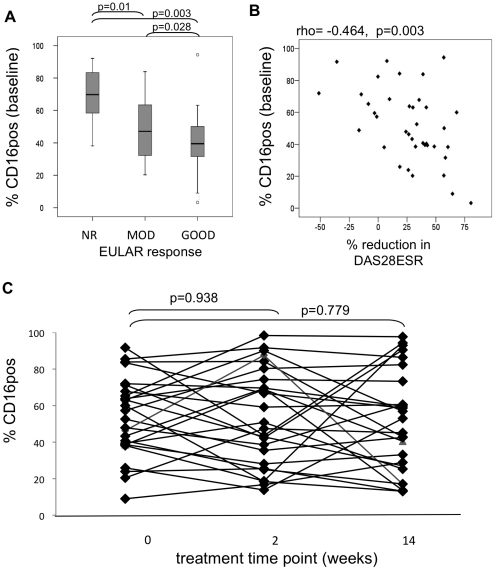
Figure 5. FcγRIIIa/CD16 expression on RA CD14++ monocytes pre- and post- methotrexate therapy.
A) The percentage of CD16 positive CD14++ monocytes was measured at baseline (y-axis) and correlated with patient responses to methotrexate treatment. Patients were classified at week 14 post-initiation of therapy as non-responders (NR, n = 12), moderate (MOD, n = 12) or good (GOOD, n = 15) according to EULAR criteria and compared using Mann Whitney U test. Dots represent outliers. (B) The percentage reduction in DAS28-ESR between 0 and 14 weeks post-initiation of therapy (x-axis) and the % of CD14++ cells expressing CD16 at baseline (y-axis). Negative levels indicate increased DAS28ESR between baseline and week 14. Statistics; Spearman's correlation. C) The percentage of CD16 positive CD14++ monocytes was measured at baseline (wk0), 2 and 14 weeks after initiation of steroid/methotrexate treatment in early DMARD-naïve RA patients. Samples at 2 weeks mainly reflect influence of steroid treatment whereas week 14 samples will mainly reflect the effect of methotrexate therapy. Wilcoxon signed ranks test used to compare paired samples pre- and post- therapy.

