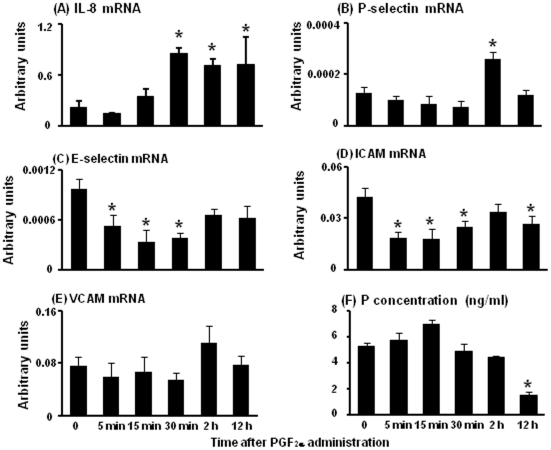
Figure 2. mRNA expression of IL-8, P-selectin, E-selectin, ICAM and VCAM in the bovine CL and plasma P concentration during PGF2α-induced luteolysis.
Fig. 2 indicates the change of mRNA expression of IL-8, P-selectin, E-selectin, ICAM and VCAM within the CL and plasma P concentration at 0 min, 5 min, 15 min, 30 min, 2 h and 12 h during PGF2α-induced luteolysis (n = 4−5 in each time), respectively. Values are shown as the means ± SEM. Different superscripts indicate significant differences (P<0.05) as determined by ANOVA followed by Bonferroni's multiple comparison test.

