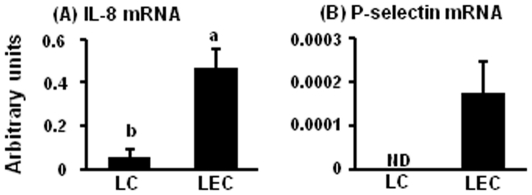
Figure 3. Expression of IL-8 and P-selectin mRNA in LCs and LECs.
Fig. 3 indicates mRNA expression of IL-8 (A) and P-selectin (B) in LCs and LECs (n = 5 in each group). All values are the means ± SEM. Different superscript indicate significant differences (P<0.05) as determined by Student's t-test.

