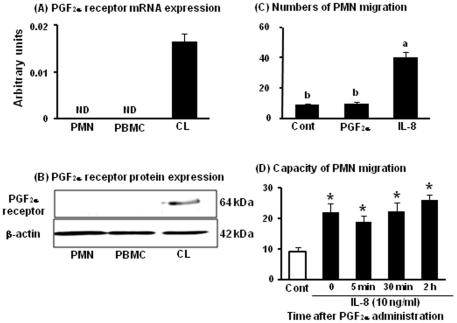
Figure 7. Expression of FPr in PMNs, PBMCs, and the mid CL and transmigration assay of PMNs by PGF2α and IL-8.
The mRNA and protein levels of FPr (A and B) in PMNs, PBMCs and the mid CL tissue (n = 4 in each group). All values are the means ± SEM (relative to β-actin mRNA levels). Representative photograph of a western blot is shown for FPr and β-actin (B). The number of PMNs migration by PGF2α (10−6 M) and IL-8 (50 ng/ml) is shown in Fig 7C (n = 4 in each group). The number of migrating PMNs after PGF2α administration is shown in Fig 7D. White bar indicates control (PMNs before PGF2α administration, IL-8 un-stimulate) and black bars indicate IL-8 (10 ng/ml)-stimulated PMNs (at 0 min, 5 min, 30 min, and 2 h after PGF2α administration, n = 4 in each time point). Values are shown as the means ± SEM. Different superscript indicate significant differences (P<0.05) as determined by ANOVA followed by the Bonferroni's multiple comparison test.

