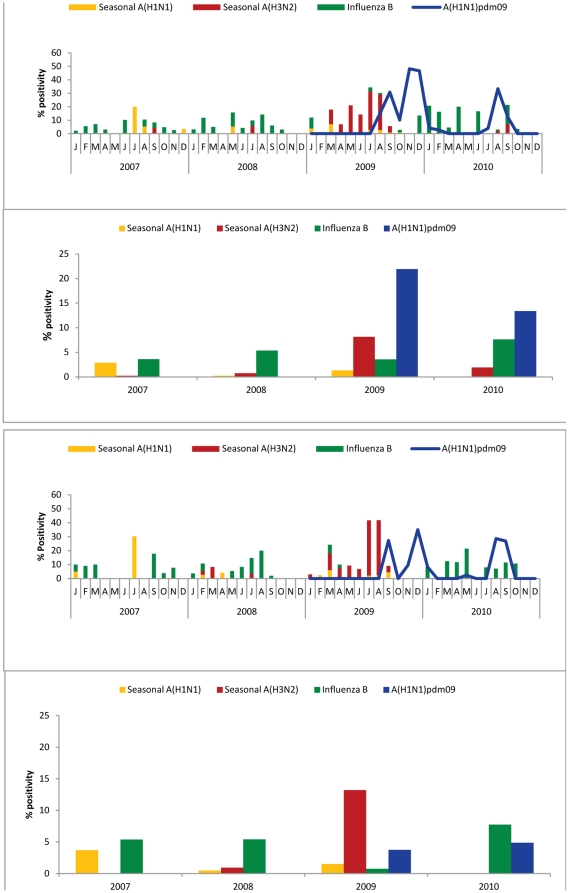
Figure 2. Monthly trends and seasonality of circulating seasonal and pandemic influenza viruses in urban (Panel A) and peri-urban (Panel B) area from 2007–2010.
The left axis shows monthly percent positivity. The overall % positivity of types and subtypes is shown as bar graph for urban (Top) and peri-urban (bottom) area from 2007 to 2010.

