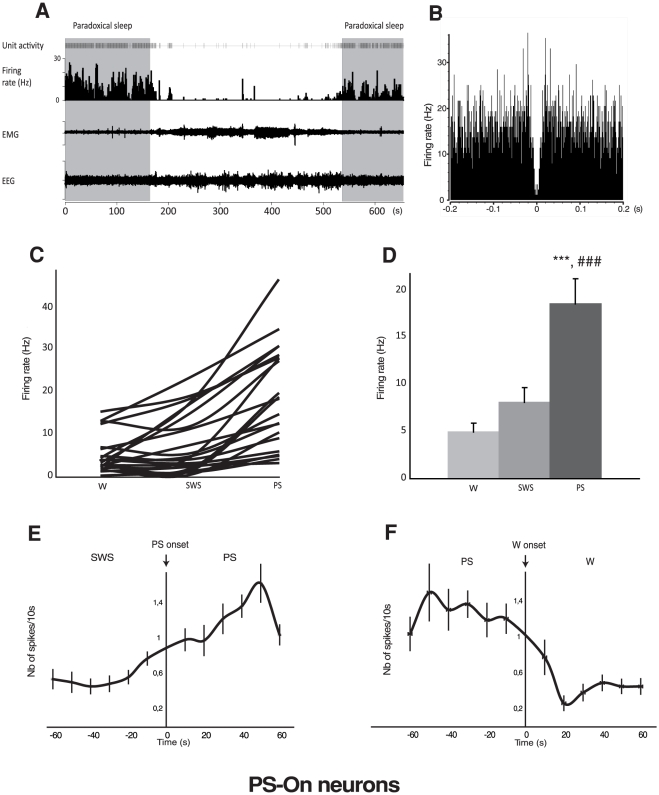
Figure 1. Discharge of the LPGi PS-On neurons across the sleep-waking cycle.
A. Unit activity of a representative PS-On neuron across 2 PS episodes bordering Waking and SWS episodes. It is clearly seen that this neuron displays a higher rate of activity during PS and that this activity starts before and ends after the PS episode. B. Autocorrelogramm of another PS-On neuron. The absence of peaks is indicative of the absence of bursting. C. Firing rate of the 21 PS-On neurons recorded in the LPGi across the sleep-waking cycle. D. Firing rate of the PS-On neurons recorded in the LPGi in the 3 vigilance states. Data are expressed as mean ± SEM, hellohellohello P≤0.001 vs Waking, ### P≤0.001 vs SWS. E. Number of spikes per 10s during the SWS/PS transition. The majority of the PS-On neurons start to significantly increase their firing rate about 10 s before the onset of PS. F. Number of spikes per 10s during the PS/W transition. The PS-On neurons stop discharging a few s after the end of the PS episodes.

