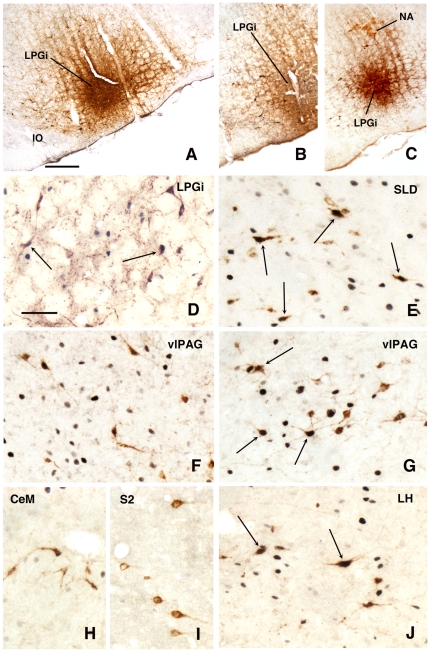
Figure 8. Fos (or TH or ChAT)/CTb labeling after injection of CTb in the LPGi.
A–F and –HJ: PS-recovery condition, G: PS-deprived condition. A: CTb injection site in the LPGi covering Fos nuclei, B: CTb injection site in the LPGi covering TH- neurons of the A1/C1 group, C: CTb injection site in the LPGi, ventrally to the ChAT- neurons of the ambiguus nucleus (NA), D: Contralateral LPGi, E: sublaterodorsal nucleus (SLD) showing many double-labelled Fos-CTb neurons, F: ventrolateral periaqueductal gray (vlPAG) in the PS-recovery condition, G: ventrolateral periaqueductal gray (vlPAG) in the PS-deprivation condition, H: single CTb neurons in the central nucleus of the amygdala (CeM), I: single CTb neurons in the pyramidal layer of the secondary somatosensory cortex (S2), J: lateral hypothalamus (LH). Arrows indicate double-labelled Fos-CTb neurons. Bar = 500 µm in A-C and 60 µm in D-J.

