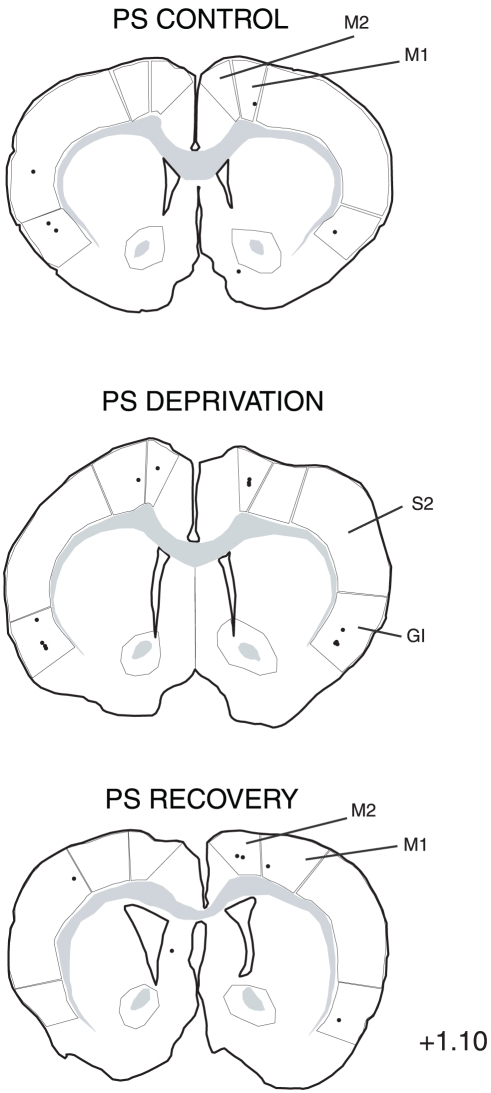
Figure 15. Distribution of the single CTb (black dots) and double-labelled Fos/CTb (red dots) neurons, as observed in the cortex of one PS control, one PS-deprived and one PS-recovery rat after injection of CTb in the LPGi, in the sides ipsilateral (right) and contralateral (left) to the injection site.
Figures refer to the distance from the Bregma. Abbreviations: GI: insular cortex; M1: primary motor cortex; M2: secondary motor cortex; S1: primary somatosensory cortex; S2: secondary somatosensory cortex.

