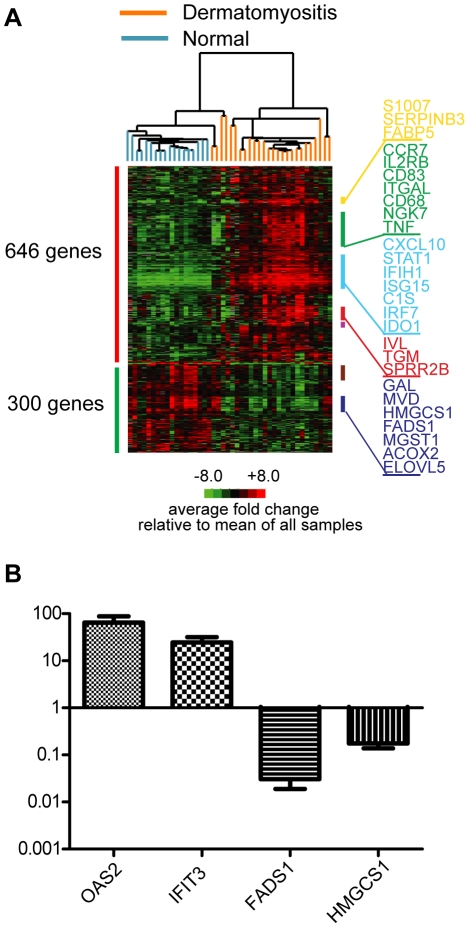
Figure 1. Visualization and validation of DM gene expression on HEEBO oligonucleotide arrays.
RNA was prepared from skin biopsies as detailed in Methods, and the same source was used for both gene expression array (A) and QRT-PCR experiments (B). A. Experimental hierarchical clustering dendrogram. Two-dimensional hierarchical clustering was performed on gene expression data from active DM skin lesions and skin from healthy controls. A set of 946 genes whose average expression significantly differed between DM and healthy controls (the “DM module) was used to group sample expression data; 646 genes were upregulated (red bar on left) and 300 genes were downregulated (green bar on left) in DM patients relative to control biopsies. All values are in log2 space and are mean-centered across each gene. Colored bars on right indicate gene clusters evident on dendrogram: yellow bar—epidermal activation; green bar—leukocyte function; light blue bar—IFN signature; red bar—epidermal differentiation; lavender bar—immunoglobulin; brown bar—ribosome; dark purple bar-lipid metabolism. A larger view of the dendrogram and more complete lists of genes in these clusters can be found in Supplementary Figure S2. B. Validation of array data using TaqMan QRT-PCR of selected transcripts. QRT-PCR was performed (see Methods) on 9 DM skin RNA samples and 8 control skin RNA samples for four selected transcripts that were either found to be upregulated (OAS2, IFIT3) or downregulated (FADS1, HMGCS1) in DM skin. Shown are the mean values (with SEM) for each transcript in DM skin relative to the mean value in control skin. Relative transcript values for each of the 4 genes across the 9 DM samples showed a high correlation (Pearson's r = 0.71 to 0.86) between the HEEBO array and QRT-PCR.

