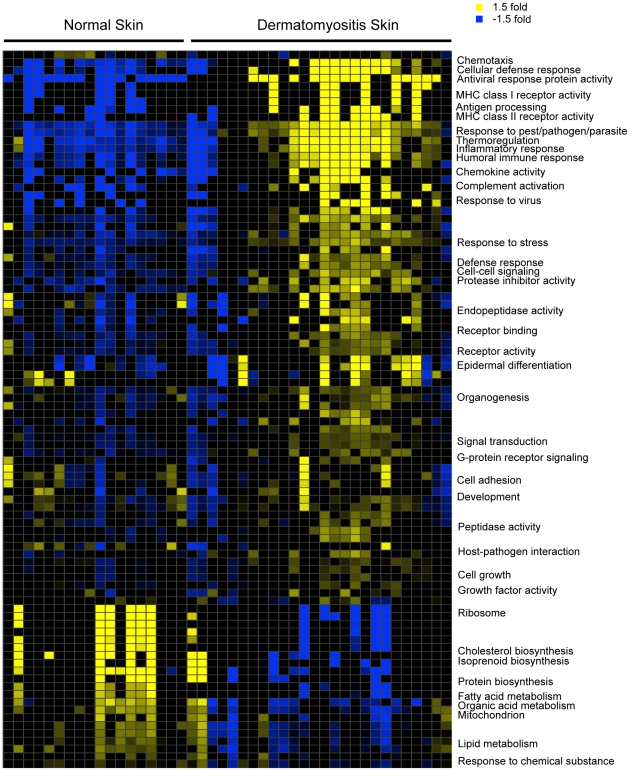
Figure 2. DM skin module map.
Module map of the Gene Ontology (GO) and Kyoto Encyclopedia of Genes and Genomes (KEGG) Biological Processes differentially expressed among the active DM samples is shown. Each column represents a single microarray (e.g. patient) and each row represents a single GO or KEGG biological process. Only modules that were significantly enriched (minimum 2-fold change, p = 0.05) on at least 4 microarrays are shown. The average expression of the gene hits from each enriched gene set is displayed here. Only gene sets that show significant differences after multiple hypothesis testing were included. Selected GO or KEGG biological processes are shown. The entire figure with all biological processes can be viewed in Supplementary Figure S3.

