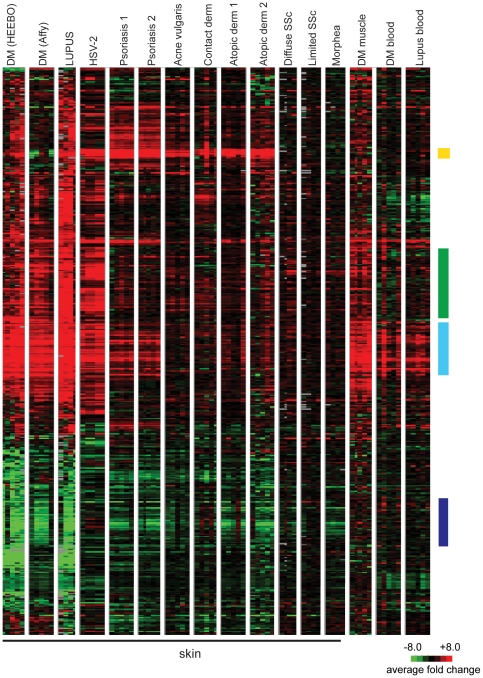
Figure 3. Mapping the DM module across different inflammatory disease tissues.
Shown is a hierarchical clustering dendrogram of gene expression data from DM and multiple other diseases. The genes visualized represent all of the genes of the DM module that are common to all of the array platforms used to generate the data shown. The expression pattern of this set of 490 genes across all of the disease states shown was clustered using average linkage clustering, while the columns (samples) were not clustered and grouped by disease and experimental dataset. Expression data for each gene is relative to the mean expression level for all healthy controls (red = upregulated; green = downregulated) within each dataset, with the exception that HSV-2 data is relative to uninvolved skin of diseased HSV-2 patients (see Methods). Each disease state is composed of five columns, representing five representative examples (patients) of each disease. DM (HEEBO) and DM (Affy) represent data from independent DM skin biopsies run on either HEEBO or Affymetrix arrays, respectively. The remaining datasets were obtained from publicly available GEO omnibus data (see Methods). All data are derived from skin biopsies with the exception of the three diseases on the right, as indicated. Colored bars on right indicate gene clusters of the DM module that were discussed in the text for Figure 1: yellow bar—epidermal barrier; green bar—leukocyte function; light blue bar—IFN signature; dark purple bar-lipid metabolism.

