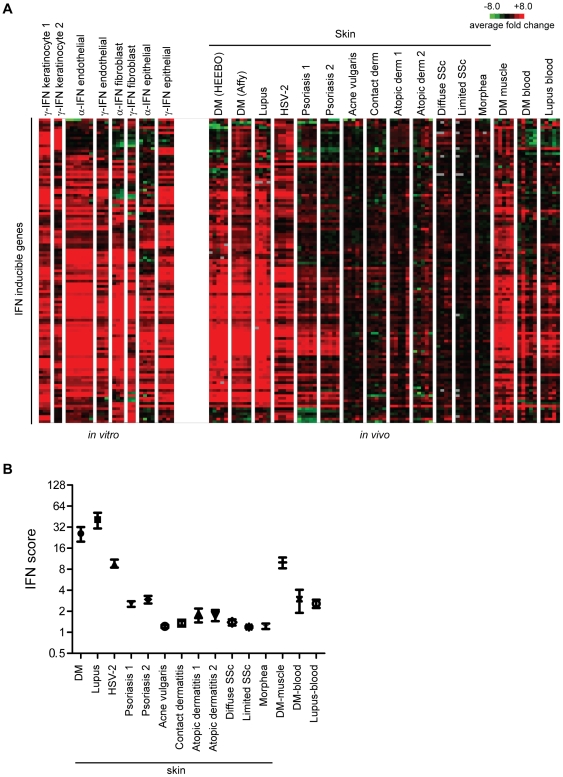
Figure 4. Visualizing the pattern and strength of the IFN signature expression across multiple disease states.
A. Heatmaps of gene expression of the IFN inducible genes both in vitro and in vivo across diseases. The expression of a set of 117 genes comprising the “core IFN signature” (labeled as “IFN inducible genes” in the figure) is shown following one-way hierarchical clustering (genes only) using the entire in vitro and in vivo dataset. The left panel shows the expression patterns of this IFN signature following various in vitro stimulations with IFN-alpha or IFN-gamma on different responding cell types, as indicated. The right panel shows the expression patterns of the IFN signature across multiple disease states. The data from the disease states were derived from publicly available data as described in Figure 3 and Methods. B. Comparing the strength of the IFN signature across disease states using an IFN score. The top 25 expressed IFN-inducible genes (a static list) was derived from the same in vitro data used to generate the core IFN signature as described in Methods. The median expression value (in linear space) of this set of 25 genes within each disease sample was defined as the IFN score for that sample. Shown is the mean and SEM for IFN scores calculated for each disease dataset represented in panel A.

