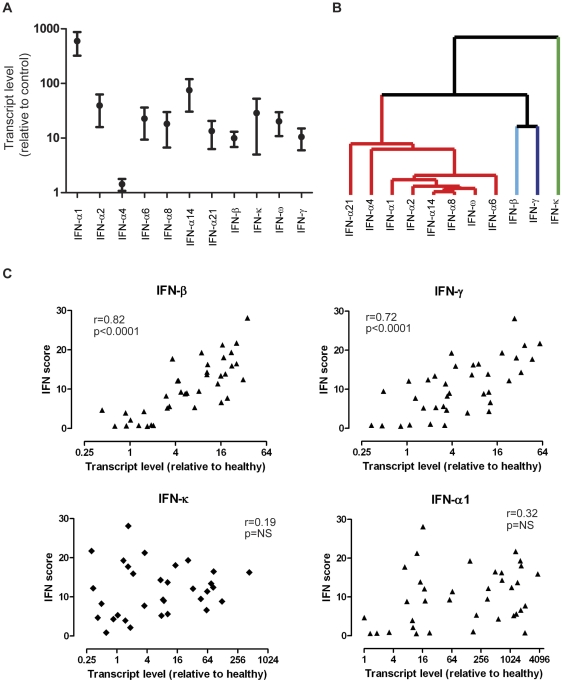
Figure 6. Expression of IFN transcripts in DM skin and correlation with downstream response.
A. Upregulation of most IFN transcripts in DM skin. QRT-PCR analysis of different IFN transcripts in DM skin samples. TaqMan PCR was performed (see Methods) on 39 DM skin RNA samples and 4 control skin RNA samples for selected IFN transcripts. Shown are the mean values (with SEM) for each transcript in DM skin relative to the mean value in control skin. B. IFN transcripts are not co-regulated across DM skin samples. Hierarchical clustering dendrogram is shown for relative IFN transcript expression levels (using QRT-PCR) across 39 DM samples. Average linkage clustering was performed using correlation (uncentered) similarity metric. Similarity branches (length is inversely correlated with similarity of expression patterns) for IFN-α and IFN-ω are shown in red, IFN-beta in light blue, IFN-gamma in dark purple, and IFN-κ in green. C. IFN-beta and IFN-gammacorrelate most closely with the IFN score in DM skin. For each RNA sample made from 39 independent DM skin biopsies, an IFN score was calculated based on transcript levels of downstream IFN-inducible genes from array data (as described in Figure 4B and Methods) as well as a relative transcript level (using QRT-PCR) for several IFN transcripts (see panel A). Shown are correlation plots (for each of the 39 samples) of the IFN score and IFN transcript levels for IFN-a1, IFN-beta, IFN-gamma, and IFN-kappa.

