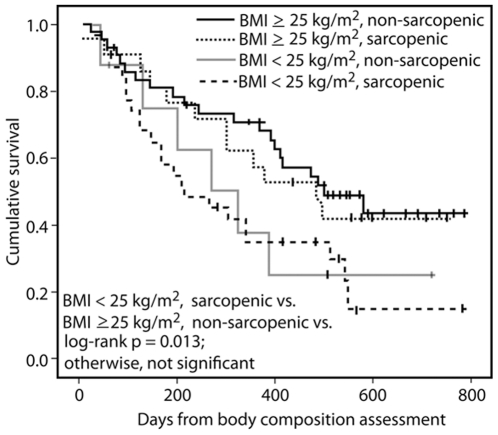
Figure 2. Kaplan-Meier curves of the four groups of patients.
Survival analyses were performed using Kaplan-Meier curves and log-rank tests to detect differences in survival among the four groups of patients (normal weight non-sarcopenic, normal weight sarcopenic, overweight non-sarcopenic, and overweight sarcopenic patients. Patients who are alive at last known follow up are censored at that date.

