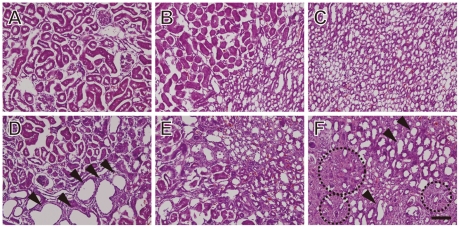
Figure 3. Histological analysis of kidney tissue sections from rats fed a control or HP diet.
Kidney sections from control rats (A, B, C) and HP rats (D, E, F) were stained with H&E and visualized by microscopy. Sections correspond to cortex (A, D), the corticomedullary junction (B, E) and the medullary region (C, F). Arrowheads indicate representative cyst-like areas; dotted circles indicate representative fibrosis-like areas. Scale bar = 100 µm.

