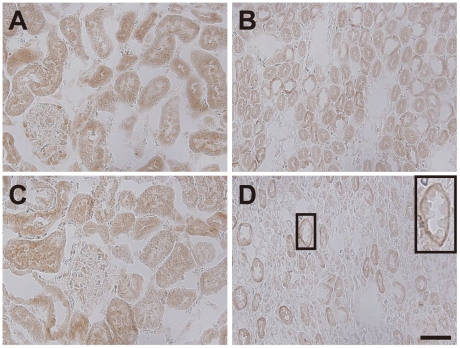
Figure 5. Immunohistochemical analysis of NaPi-IIb in the kidney of control and HP rats.
Tissue sections from control (A, B) and HP (C, D) rats were analyzed by immunohistochemistry using an anti-NaPi-IIb antibody. Sections represent cortex (A, C) and the medullary regions (B, D). Scale bar = 50 µm.

