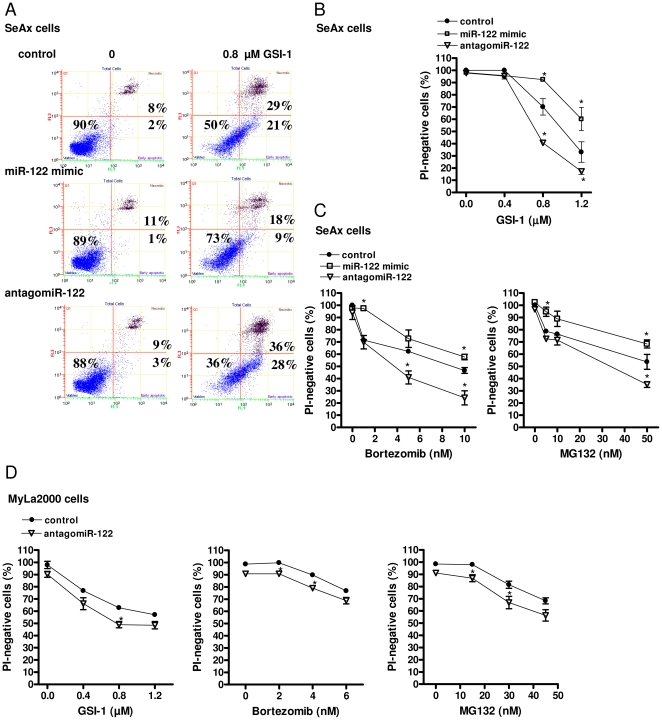
Figure 2. miR-122 increases resistance to GSI-1 and proteasome inhibitors.
A) SeAx cells were transfected for 24 h with either scrambled siRNA (control), miR-122 mimic or antagomiR-122 and treated for 48 h with GSI-1 (0.8 µM) followed by annexin V and propidium iodide staining for flow cytometry, as described in Methods. The dot-plot graphs (annexin V: green FL1 channel, x-axis; PI: red FL3 channel, y-axis) are representative of three independent experiments. B–C) Effect of antagomiR-122 and miR-122 mimic on the apoptosis induced by GSI-1 (at the concentrations 0.4, 0.8 and 1.2 µM; 48 h) (B), bortezomib (1, 5, 10 nM; 48 h) (C, left panel) and MG132 (5, 10, 50 nM; 48 h) (C, right panel) in SeAx cells. Cell viability is expressed as percentage of the PI-negative cells calculated by flow cytometry. Points, mean (n = 3); bars, SEM. *p-value<0.05 compared to cells transfected with scrambled oligonucleotide. D) MyLa2000 cells were transfected for 24 h with either scrambled siRNA (control) or antagomiR-122 and treated for additional 24 h with GSI-1 (at the concentrations 0.4, 0.8 and 1.2 µM) (D, left panel) bortezomib (2, 4, 6 nM) (D, middle panel) and MG132 (15, 30, 45 nM) (D, right panel). The percentage of the PI-negative cells was calculated as in (B). Points, mean (n = 3); bars, SEM. *p-value<0.05 compared to cells transfected with scrambled oligonucleotide.

