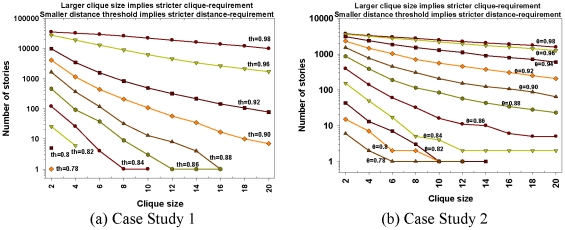
Figure 10. Variation in number of stories.
The number of stories generated decreases monotonically with stringent clique size and distance threshold requirements. Plot (a) shows the number of stories with different parameters but same 50,751 start-end document pairs of case study 1. Plot (b) shows a similar graph with 5,646 start-end document pairs of case study 2. Note that both the plots depict monotonic decrease in number of stories with stringent clique size and distance threshold parameters.

