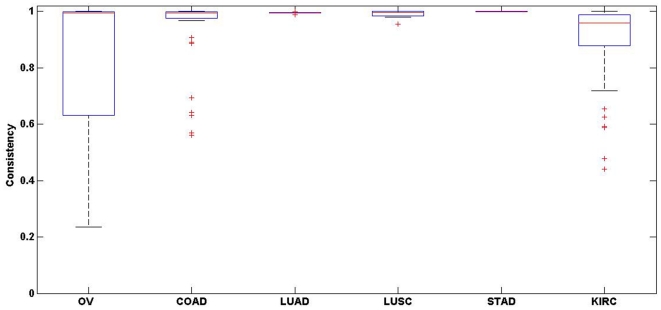
Figure 2. Batch effects on DM genes of six cancer types.
For each cancer type denoted in the x-axis, a box plot in the y-axis represents the consistency score defined as the proportion of DM genes with consistent methylation states among all overlapping DM gene commonly detected in both of the two groups (see ‘Methods’ section). The consistency score takes value ranging from 0 (no consistent states) to 1 (100% consistent states). Each box stretches from the lower hinge (defined as the 25th percentile) to the upper hinge (the 75th percentile) and the median is shown as a line across the box.

