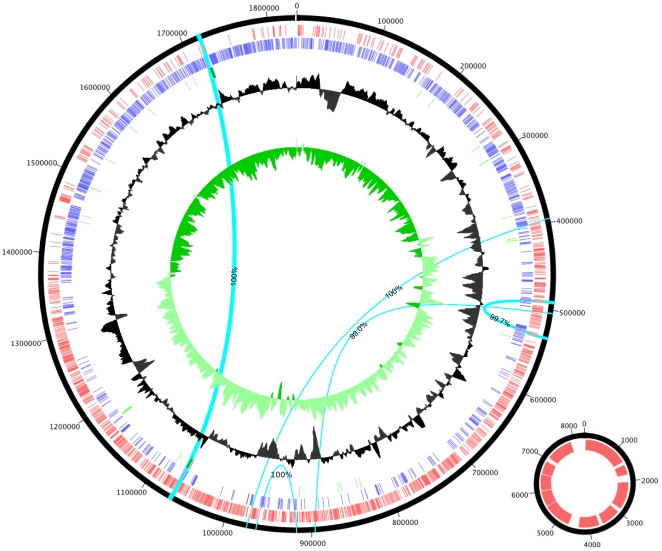
Figure 1. Circular representation of the chromosomal and plasmid replicons of Oenococcus kitaharae.
Tracks represent (from largest to smallest) plus strand ORFs (red), minus strand ORFs (blue), RNA (tRNA light green, rRNA dark green), %GC and GC skew. The location of the five, two-copy repeats that are present in the O. kitaharae genome are also shown (light blue bars). Each of the five repeat groups are connected by arcs with the associated level of homology between each repeat listed.

